Note: The following analysis is based on simulations which is dependent on the stated assumptions and only ten data points of actual confirmed cases in Davao Region. Changes in these inputs may introduce changes in the overall dynamics of transmission. Thus, it is advised to exercise caution in the interpretation and use of this output.
Using the Susceptible, Exposed, Infectious and Recovered (SEIR) model, the impact of quarantine measures is explored. All calculations were done using the R Statistical Software. The probability of infection and activity rate (controls how fast people move from being susceptible to exposed), exposure to infection rate (controls how fast people move from being exposed to infected), and recovery rate (controls how fast people move from being infected to resistant or mortality) were the parameters considered with the following assumptions.
- The probability of infection was set at 0.7, based on the literature that the virus stays long on clothes, metals and plastics and thus the chance of infection upon exposure is considered high.
- Exposure to infection rate was set to 0.2, which means 5 days on the average for the incubation period.
- Infection to recovery rate is assumed, on the average, to be around 0.02 or around 20 days for recovery.
- Initial number of infected cases is 50 people (March 30, 2020).
Scenario/Case 1: No Quarantine Measures.
- Activity rate (interaction of every person per day) is assumed to be 10, because people are free to move and interactions among the networks (workplace and communities) are high.
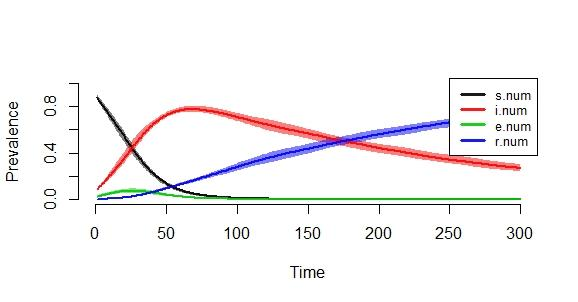
Notes: s.num – susceptible ; i.num – infected; e.num – exposed; r. num – recovered
Without home or community quarantine measures, the peak of infection would be around 70 to 80 days from March 30, 2020. This will be around the middle of June 2020. The virus would also have around 80% prevalence of infection at its peak. It would take more than 300 days (more or less a year) before the region would have a full recovery rate.
Scenario/Case 2: Home or Community Quarantine.
- Activity rate (Interaction of every person per day) is assumed to be 2. This is due to the fact that despite the community quarantine measures, some people refuse to stay home or they have to run important errands.
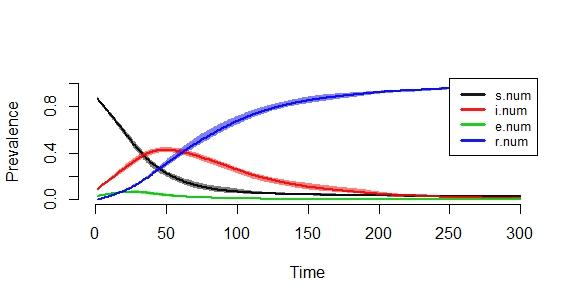
With home or community quarantine measures, the peak of infection would be around 40 to 50 days from March 30, 2020. This will be around the middle of May 2020. The prevalence of infection would also be around 50% at the most. This is a significant reduction from the 80% prevalence of infection in Scenario 1 (No home quarantine). However, the recovery time for the region in this scenario would take around 4 to 5 months. This is a long period of time and opportunity costs are high, considering that the economy, education and other sectors are affected by the quarantine measures.
Scenario/Case 3: Under Enhanced Community Quarantine.
- Activity rate (Interaction of every person per day) is assumed to be 0.5.
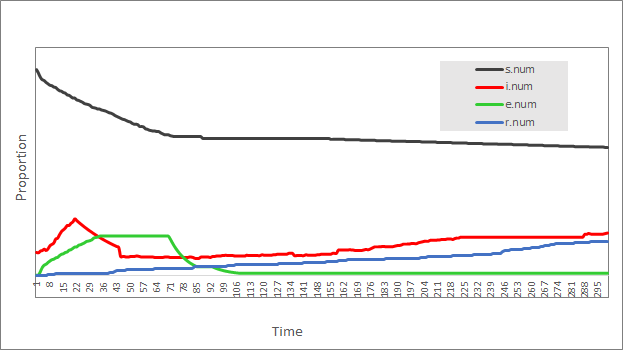
Under enhanced community quarantine, the peak of infection would be around 18 to 20 days from March 30, 2020 which will be around mid-April 2020. The prevalence of infection would also be around 15% at the most. This is a significant reduction from the 80% prevalence of infection in Scenario 1 (No home quarantine) and 40% prevalence of infection in Scenario 2.
Prevalence of COVID-19 Infection under three Scenarios
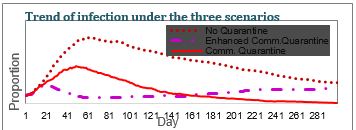
We have shown that the implementation of the Enhanced Community Quarantine is significant in reducing the infection rate. The dynamics of transmission is different under three simulated scenarios. The community and enhanced community quarantine measures are found to be useful in slowing down the rate of infection and protecting the large fraction of susceptible population from being infected. However, as with any other control measures in a complex biological system such as disease transmission, the effectiveness lies within the willingness and capacity of the subjects or people to fully cooperate.
++++++++++++++++++++++++++++++++++++++++++++++++++++++++
This simulation was done by Mr. Roel Ceballos, a faculty of statistics, and an editor of the official research journal of the University of Southeastern Philippines. You may reach the author at roel.ceballos@usep.edu.ph