Statistics
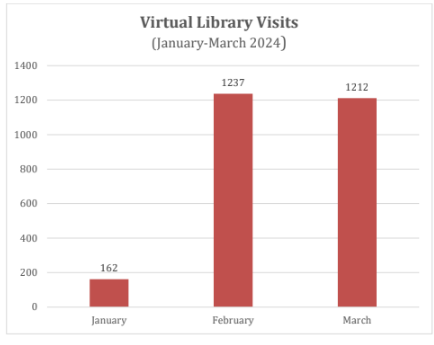
The chart shows the Virtual Library visits from January to March 2024. Asshown, February has the highest number of visits, with 1237 or 47%.Meanwhile, January had 162, or 6%.
Meanwhile, February had the highest number because students' assignments,projects, research, and other deliverables were at their peak. At the same time, January had the lowest, with 1543 or 16%, primarily due to the start of the semester.
SUBSCRIBED DATABASES USAGE REPORT
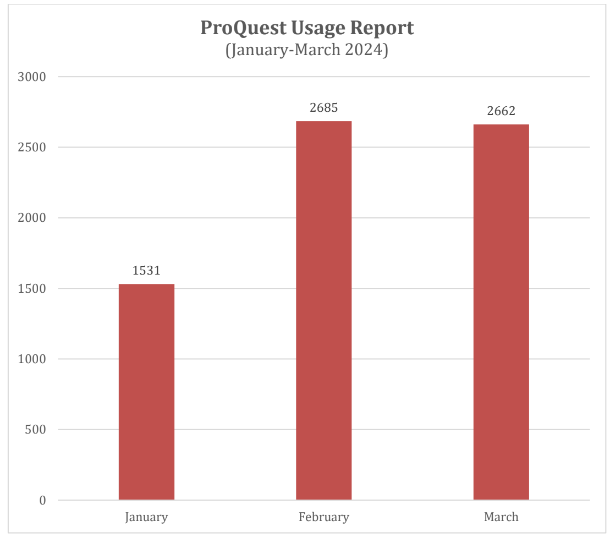
The chart shows the ProQuest usage report from January to March 2024. February and March has the highest number, with 2685 or 39%, followed by March with 2662 or 39% and January with 1531 or 22%. February and March have the highest number of visits because students' assignments, projects, research, and other deliverables are at their peak.
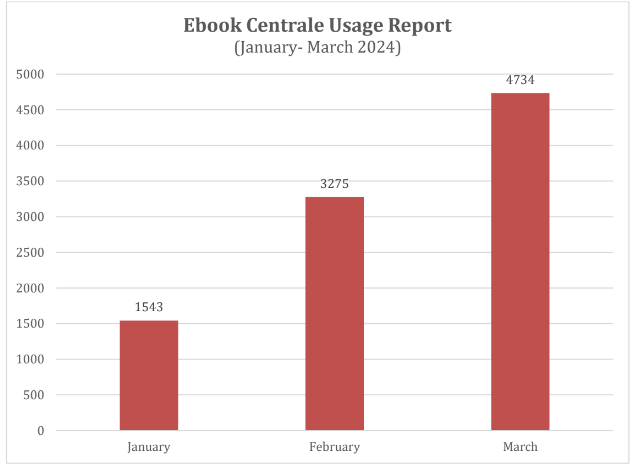
The chart shows the Ebook Centrale usage report from January to March 2024. March has the highest number, with 4734 or 50%, followed by February with 3275 or 34%. Meanwhile, March has the highest number because students' assignments, projects, research, and other deliverables are at their peak. At the same time, January had the lowest, with 1543 or 16%, primarily due to the start of the semester.
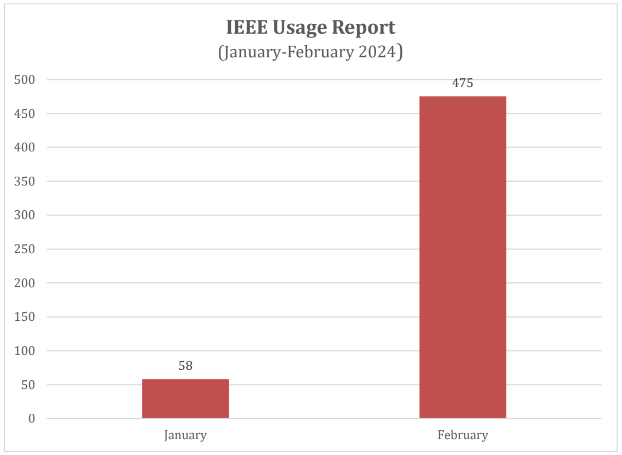
The chart shows the IEEE usage report from January to February 2024. February has the highest number, with 475 or 89%, followed by January with 58 or 11%. However, January had the lowest, primarily due to the start of the semester. Meanwhile, the data for March 2024 has yet to be available.
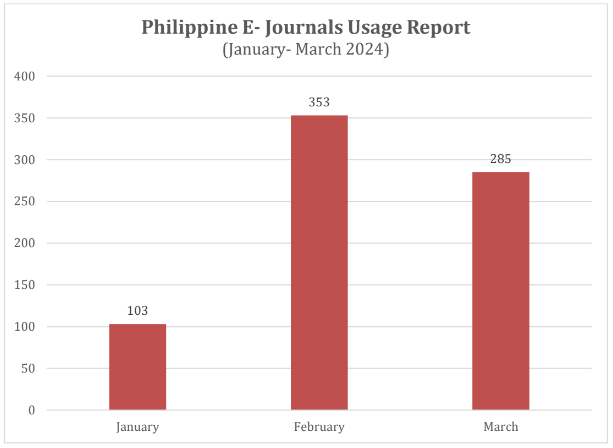
The chart shows the Philippine E-Journals usage report from January to March 2024. February has the highest number, with 353 or 48%, followed by March with 285 or 38%. However, January had the lowest, with 103 or 14%, primarily due to the start of the semester.
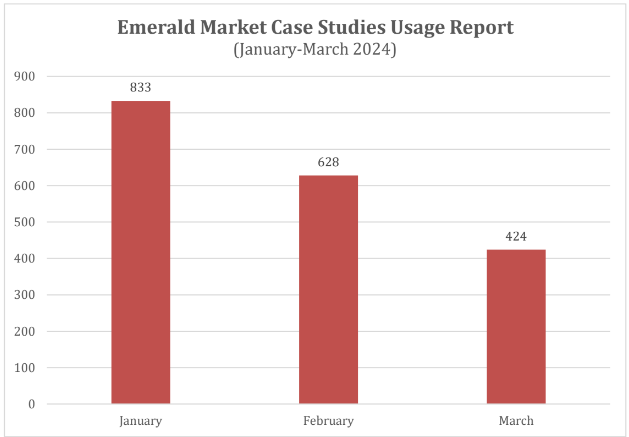
The chart shows the Emerald Market Case Studies usage report from January to March 2024. January has the highest usage with 833 or 44%, followed by February with 628 with 33%. March has the lowest with 424 or 23%.
ACADEMIC RESEARCH TOOLS USAGE REPORT
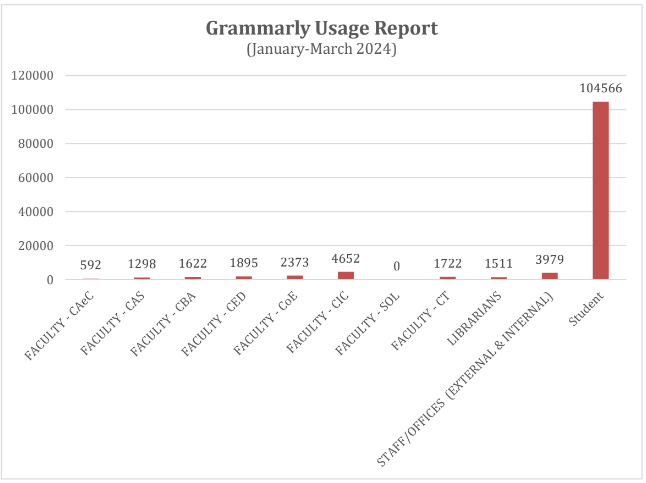
The chart shows the Grammarly usage report from January to March 2024. Students has the highest usage, with 104,566 sessions or 84%, followed by the CIC Faculty with 4,652 sessions or 4%, and the Offices/Staff accounts with 3,979 or 3%..
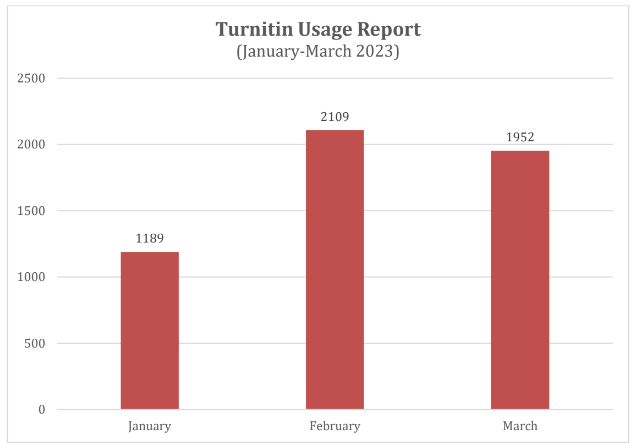
The chart shows the Turnitin usage report from January to March 2024. February has the highest usage with 2109 or 40%, followed by March with 1952 with 37%. January has the lowest with 1189 or 23%. primarily due to the start of the semester.